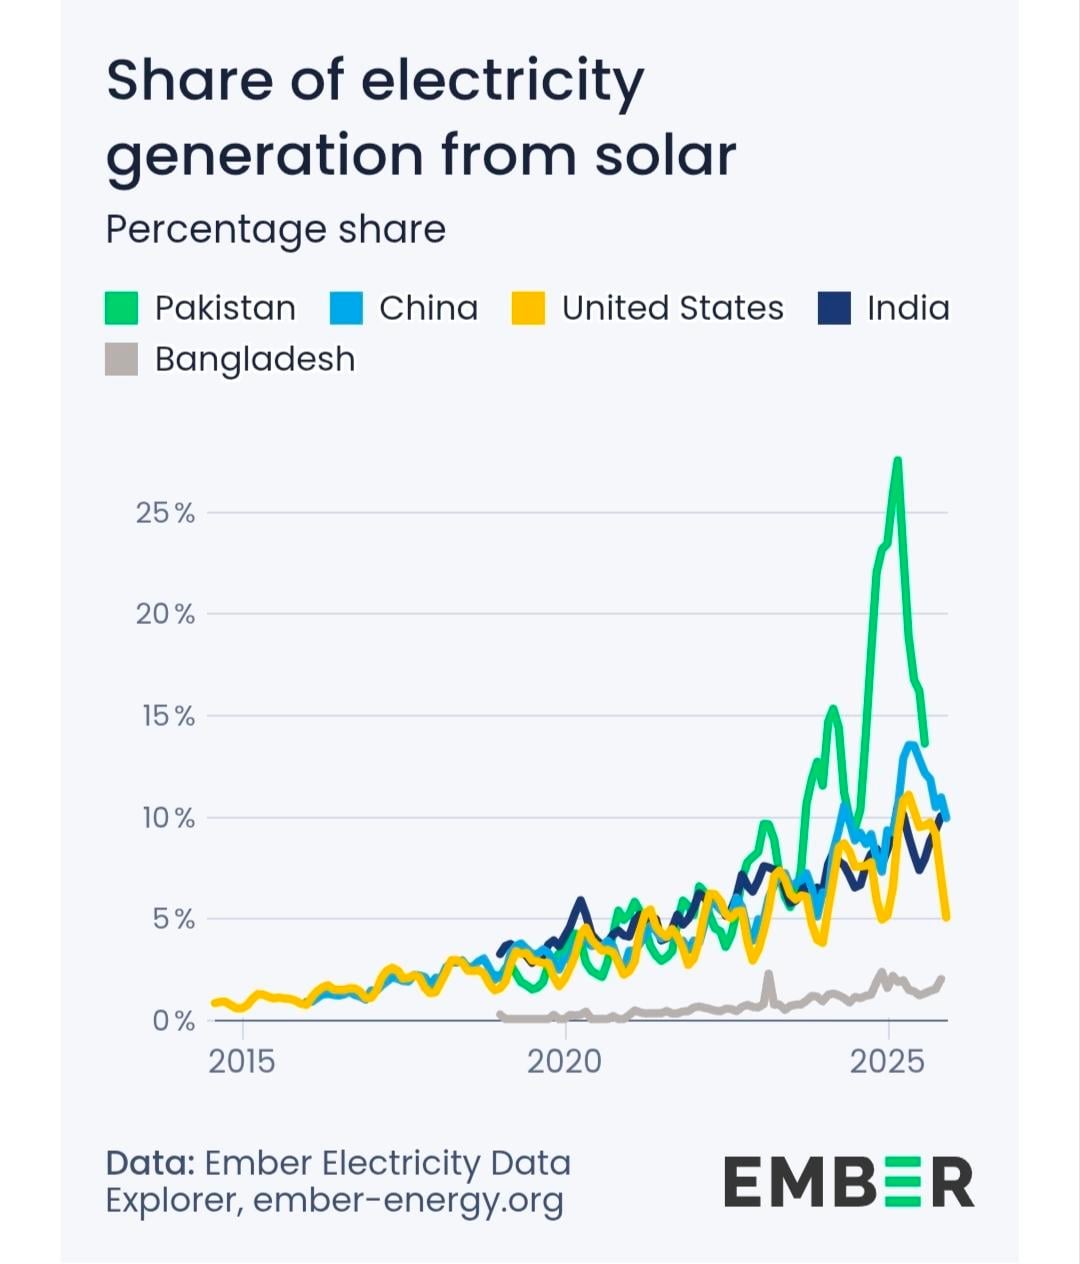
The month graph shows the clear seasonal fluctuations in solar, but it also shows how the trough baseline is also increasing year by year – the worst 2025 is nearly better than the best 2024 and the same for 2023 vs 2024.
This is how variable renewable sources can supply baseload power.

1 Comment
The month graph shows the clear seasonal fluctuations in solar, but it also shows how the trough baseline is also increasing year by year – the worst 2025 is nearly better than the best 2024 and the same for 2023 vs 2024.
This is how variable renewable sources can supply baseload power.